
BUDGET SPEECH HIGHLIGHTS 2018
April 26, 2018
MARKET X-RAY
September 27, 2018
DO YOU SWITCH YOUR STRATEGY?
Are you considering changing to a more conservative investment strategy?
Currently investors face the reality of negative real returns and a situation where Money Market investments have outperformed the average Balanced Fund Manager over the past 3 to 4 years. When comparing returns between the funds of Allan Gray, it becomes more startling to learn that the more conservative mandate of the Allan Gray Stable Fund has outperformed the Allan Gray Balanced and the Allan Gray Equity Funds over the past 4 years!
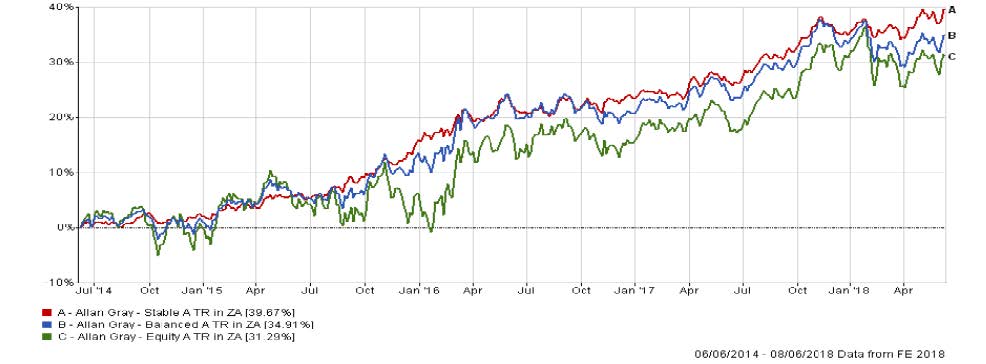
The Allan Gray Stable Fund is more ‘stable’ relative to Allan Gray Balanced and Allan Gray Equity Funds. Investors have therefore questioned our holdings in the Allan Gray Balanced / Equity Funds and have asked if it is not more appropriate to switch to the Allan Gray Stable Fund.
Before making any changes we advise that you and your advisor analyse your risk appetite/capacity and investment horizon to match the ideal fund/portfolio for your investment needs.
Analysing the funds, one understands that the Allan Gray Stable Fund holds on average 40% of the fund in risk assets (SA & Global Equities / Property), while the Allan Gray Balanced Fund on average – holds 70% of the fund in risk assets. The Allan Gray Equity Fund holds close to 100% of the fund in SA / Global equities or risk assets. Therefore, when risk assets go through a poor performance period, the Allan Gray Balanced and Allan Gray Equity Funds can underperform the Allan Gray Stable Fund.
We analysed previous incidents of this occurrence where the Allan Gray Stable Fund outperformed the higher risk funds over 4 years. This has occurred only once since October 2004. The previous occurrence, over a 4 year rolling periods, was after the Global Credit Crisis (GCC) and lasted from 31 December 2010 to 31 March 2012. The absolute low at quarter end was on 30 September 2011 as the diagram below highlights. The chart shows the 4-year rolling returns of the Balanced and Equity Funds relative to the Stable Fund. Above the line, the “riskier” funds outperformed and vice versa.
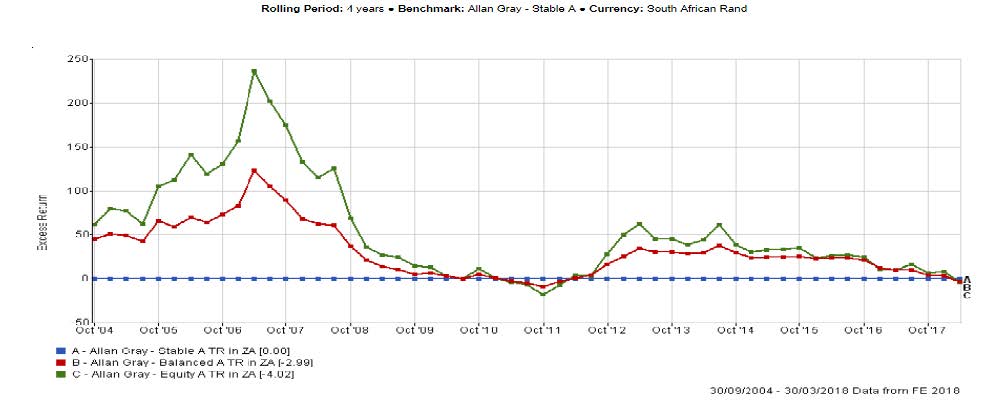
The graph clearly indicates that immediately after the bottoming out of the negative relative return period, the excess returns of the Allan Gray Balanced and Equity Funds improved dramatically.
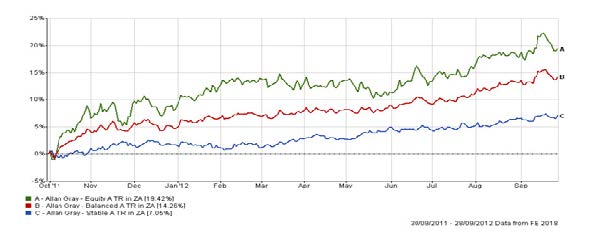
The following 12 months after the bottoming out-delivered returns of +14.26 % for the Allan Gray Balanced Fund and 19.42% for the Allan Gray Equity Fund, while the Allan Gray Stable Fund returned 7.05% over the same period.
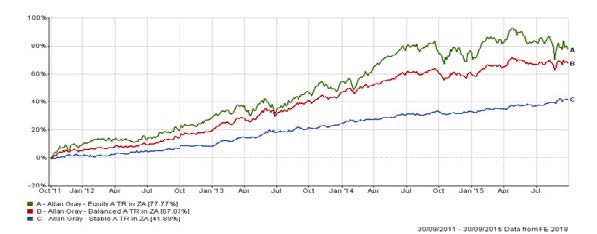
Importantly, the 4 years after the bottoming out on 30 September 2011 was followed by a 4 year annualised return of 9.14% p.a. for the Allan Gray Stable, 13.83% p.a. for the Allan Gray Balanced and 15.47% p.a. for the Allan Gray Equity Funds.
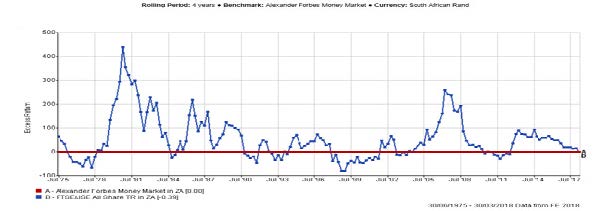
There is thus no surprise in seeing that the FTSE JSE All Share Index did not outperform the Money Market over the past 4 years! The excess return rolling chart below indicates that there have been numerous occasions in the past where the JSE under-performed the Money Market over 4 year rolling periods – only to be followed by significant recovery periods.
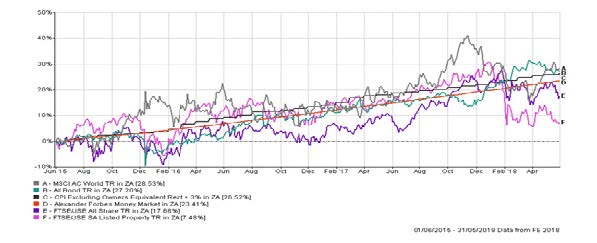
All other South African asset managers with risk-profiled solutions have seen their conservative funds outperform their riskier funds over the past 4 years. It has been challenging to outperform CPI +3% p.a. in the past 3-4 years. Only the All Bond Index has outperformed CPI +3% p.a. over the last 3 years and that only recently.
Do we think history can repeat itself?
We continue to believe that investors should remain invested in SA shares/bonds and international equities.
- We need to remind ourselves that we are only three and half months post-Zuma, with Ramaphosa taking over the presidency with a “new broom sweeps clean” approach that has hardly been priced into markets.
- Post the sell-off in March and the weak performance of SA Equities relative to Emerging Market equities we are of the view that South African equities are offering improved value – especially relative to any period in the past 5 years.
- The best value in domestic SA shares currently lies in the mid and small cap stocks and the sector can be viewed as the second cheapest sector in the world. We approach the allocation to this asset class with caution until we see evidence of a more sustained economic growth in SA.
- Lower Interest rates, higher minimum wages and above CPI government wage increases will boost the retail spending power of South Africans, but higher fuel prices and increased VAT will neutralise this effect somewhat.
- Global Economic Growth remains well grounded.
- When excluding Naspers (NPN) & Steinhoff (SNH), the projected dividend yield on the JSE_FTSE All Share Index is 3.9%. Financial shares project a 4.9% forward dividend yield.
- Our 10 year SA Bond yield currently trades above 9% and as our Reserve Bank targets Inflation at 4.5% p.a., the 4%+ real yield offered by SA Government Bonds remains attractive as a diversifier in an SA portfolio.
In our SA portfolios, we are more optimistic, relative to any time during the past 4-5 years, about SA domestic shares in the medium term, but continue holding on to our exposure to SA rand-hedged stocks. Provided that offshore markets do not move into a ‘risk-off’ mode due to worries about quantitative tightening, trade wars or fears of growth slowing, SA equities could enjoy a rebound from current levels. Our opinion is that recent dollar strength is temporary in nature.
Do not despair, if history is anything to go by, the next 4 years may see improved real returns which can boost our wealth in SA capital markets.
It is ‘time in the market’, not ‘timing the market’ that defines long-term inflation-beating returns for investors. Remain invested, no-one knows the future and can time the ‘bottom’ of the market …
Disclaimer:
This is not to be used as financial advice and always consult with your financial advisor before making any decision regarding pension fund withdrawals or transfers. These tax implications are subject to change.